Clang && lldb #
听说clang+lldb >= gcc + gdb, 所以一试:
lldb基本命令 #
与GDB相同
- break (b) - 设置断点,也就是程序暂停的地方
- run (r) - 启动目标程序,如果遇到断点则暂停
- step (s) - 进入下一条指令中的函数内部
- backtrace (bt) - 显示当前的有效函数
- frame (f) - 默认显示当前栈的内容,可以通过
frame arg进入特定的 frame(用作输出本地变量) - next (n) - 运行当前箭头指向行
- continue (c) - 继续运行程序直到遇到断点。
clang hello.c -g -o hello
lldb hello
# lldb
b main
run
n
p str
还有颜色 😂 可视效果确实提高了不少 而且这四个工具可以混用,也蛮好.
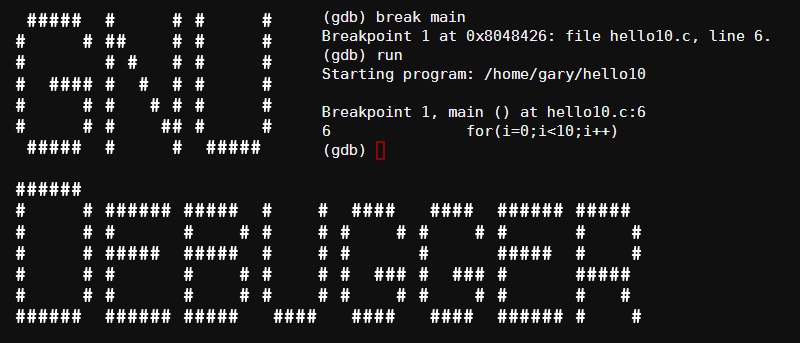
GDB #

First and foremost, you will need to compile your program with the flag “-g” (for debug) to run it via GDB. From there the syntax to start debugging is:
$ gdb -tui [executable's name]
placing breakpoints
break [line number]     or   b [line number]

or [file name]:[line number]
or [function name]
And even better, can set conditional breakpoints:
break [line number] if [condition]
For example, can set (if have a loop)
break 11 if i > 97
Place a “watchpoint” which will pause the program if a variable is modified:
watch [variable]
Once our breakpoints are set, we can run the program with the “run” command, or simply:
r [command line arguments if your program takes some]
How we got to that point:
bt
Display all the local variables and their current values.
info locals
Of course:
p [variable]       ptype [variable]

step

next

delete [line number]

continue

quit
Playing with fire. As well do it all the way:
set var [variable] = [new value]